Things are looking only worse marking the World Day of Remembrance.
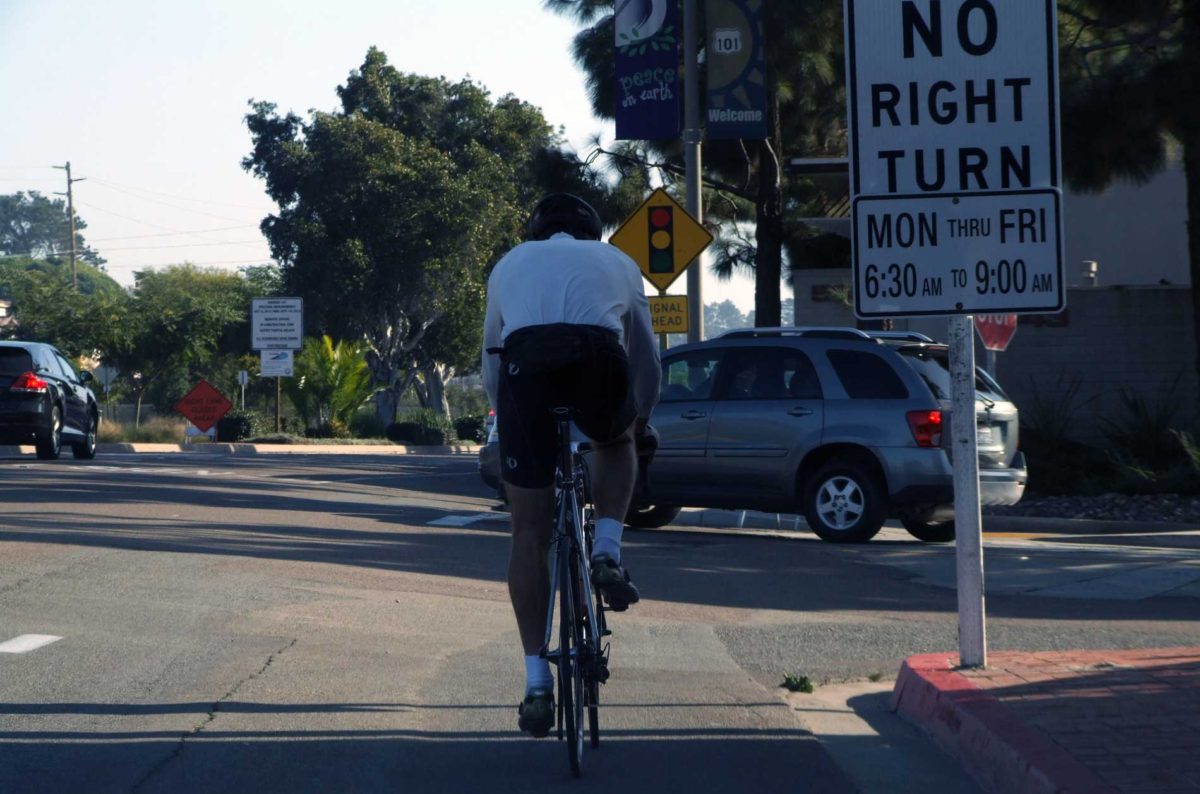
Southern California is in the middle of a true crisis with cyclists and pedestrians being mamed and killed on streets with alarming frequency. Little seems to have changed for the better if not getting actually worse.
With the city’s Vision Zero deadline of 2025 just over one year away, the death toll on San Diego streets is essentially unchanged. Two people died in collisions on Thursday (11/16/2023), bringing the number of traffic deaths in 2023 to at least 50, according to city data. In 2022, at least 53 people died in collisions in the same time period.
On ‘World Day of Remembrance,’ families to honor victims of traffic collisions
Officials in San Diego County are listening. In fact, the San Diego County officials created a new tool to get public input about areas that they have safety concerns walking, biking, or maybe could be leveraged for network connectivity or would benefit a regional destination.
As SANDAG (San Diego Association of Governments) prepares to update their Active Transportation Plan, they are looking for public input. San Diego’s Active Transportation Plan has not been updated since 2010, years before San Diego Association of Governments adopted Vision Zero (2015).
You can help San Diego regional planners by sharing your knowledge of dangerous roads and intersection locations, or places you would like to be able to walk or bike to, or make multi-modal connections through.
“So traffic fatalities, 250 in the San Diego region alone in the last year,” Mieier said [Antoinette Mieier, SANDAG’s Senior Director of Regional Planning]. ” And a third of those fatalities involved pedestrians.“
‘Make your mark’: SANDAG seeks public input to improve pedestrian and bicyclist safety
You can find the interactive San Diego County Map online and add your input.
The San Diego map with public input itself should be helpful to those who like to walk or ride their bikes because it informing awareness through the public sourced resource about where to avoid for the time being. For instance, today, the map says there have been 1063 contributions. On the map, locations on the map display a number and the mark for the location changes size and color by relative number of contributors who have identified that same location.
Is there a particular street that you would like to bike or walk on, but you don’t feel safe? Where have you recently experienced a close call on the road while driving, walking, or biking? Are there regional destinations that would benefit from a new or improved biking connection?
Vision Zero Safer Streets SANDAG Interactive Map for your input
Meanwhile, students at Kennedy School of Government have conducted research to estimate the cost of supporting infrastructure for cars, and the cost whether or not a household owns or does not own a vehicle. The costs are shared by all because about half of the car infrastructure costs (parking, roads etc.) comes from public funds, thus shared by all residents. They put the costs for all households with and without cars at $14,000 with additional costs for those who do own vehicles.
The study authors hope that this data which should be fairly similar for other states.
The costs of any other type of transportation project for any mode can now be roughly compared to the costs already supported by the public for car infrastructure by all residents including households without a car at $14,000. Such comparisons would seem to lend assistance to transportation equity.
A team of graduate students at the Harvard Kennedy School estimate that the annual price tag for maintaining Massachusetts’ car economy is roughly $64.1 billion, with more than half of that coming from public funds. […]
Using publicly available data, the authors put the annual public tab at $35.7 billion, which amounts to about $14,000 for every household in the state. Those that do own vehicles pony up an additional $12,000 on average in direct costs.
The authors say their goal is to demonstrate the total costs of driving so that information can be used for comparison when held up against other types of transit investments, like bus, subway, and train systems.
Driving is more expensive than you think
$14,000 for every household whether or not they own a car! Transportation equity for a household or individual who lives car free and relies on public transportation or a bicycle for all trips is left paying for car infrastructure but not getting improvements of the same proportion to other public transportation infrastructure. That is a whopping amount of money paying for car infrastructure costs like parking for those who do not drive or can’t drive like senior citizens and those who can not afford the expense of owning a vehicle.
Transportation planners sometimes point out that bicycle infrastructure and pedestrian sidewalk infrastructure improvements are considerably less expensive than road infrastructure for cars.
For instance the Mayor of one New Jersey city has actually been able to achieve Vision Zero using low cost and well known tactics to improve safety, six years of no pedestrian fatalities and almost half of the roads have bicycle lanes.
Armed with the Vision Zero plan, Hoboken has steadily been making incremental changes to its streets and transportation policies — with profound results. In 2021, Bhalla welcomed Citi Bike, which as of this summer has recorded more than 850,000 trips. In 2022, he lowered the citywide speed limit to 20 miles per hour (32 kilometers per hour). Crosswalks have been painted and repaved to increase their visibility, and more than 40 curb extensions have been installed to nudge cars farther from intersections. Today, nearly half of Hoboken’s roads have bike lanes.
[…] we kind of take a bird’s eye view of that area and see what low-cost, high-impact measures we can implement in order to make that part of Hoboken a little bit safer. So just with a bucket of paint, you can actually create a curb extension; you can create high visibility crosswalks, which create a much safer environment at a very cheap cost.
The New Jersey Mayor With a Plan to End Traffic Deaths
In Hoboken, Mayor Ravi Bhalla has worked to redesign city intersections, install bike lanes and slow traffic. The result? Six-plus years of no pedestrian fatalities.
Of course the cost for road improvements and bicycle and pedestrian infrastructure varies greatly.
Many specifics need to be pinned down, but StreetsBlog has some interesting discussion of the range of these costs, for sidewalks, for roads, for bike lanes of various types, $20,000 vs. $100,000-$1,000,000 per mile:
An FHA handbook from 2015, Incorporating On-Road Bicycle Networks into Resurfacing Projects, provides some basic numbers to start with. “Many communities contacted during the production of the Workbook indicated that their average cost to add bike lanes during a resurfacing project is approximately $20,000 (2015 dollars) per mile.”
According to Streetsblog’s sources, the costs to completely repave a road usually vary in the range of $100k per mile up to $1 million per mile – with some outliers. That covers construction costs for complete rehabilitation of a roadway, including scraping and replacing pavement, adding curbs and curb ramps, placing signals and detectors, and restriping and repainting lanes, but not widening a road.
Breaking Down Caltrans’ Cost Estimate of the Complete Streets Bill


