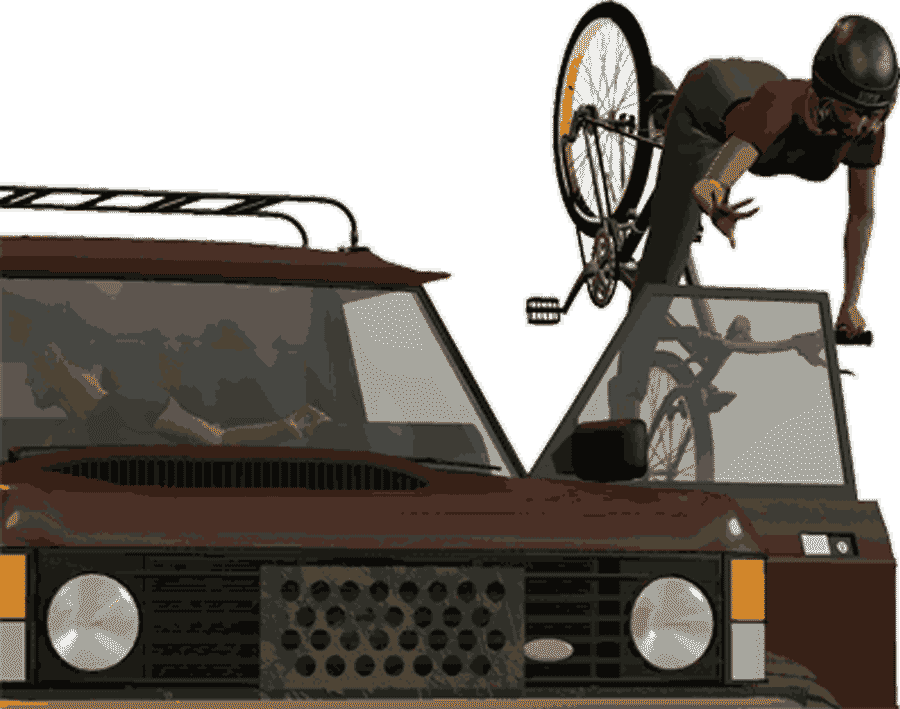
8 Years of San Diego Vision Zero

Things are looking only worse marking the World Day of Remembrance.

Southern California is in the middle of a true crisis with cyclists and pedestrians being mamed and killed on streets with alarming frequency. Little seems to have changed for the better if not getting actually worse.

With the city’s Vision Zero deadline of 2025 just over one year away, the death toll on San Diego streets is essentially unchanged. Two people died in collisions on Thursday (11/16/2023), bringing the number of traffic deaths in 2023 to at least 50, according to city data. In 2022, at least 53 people died in collisions in the same time period.

On ‘World Day of Remembrance,’ families to honor victims of traffic collisions

Officials in San Diego County are listening. In fact, the San Diego County officials created a new tool to get public input about areas that they have safety concerns walking, biking, or maybe could be leveraged for network connectivity or would benefit a regional destination.

As SANDAG (San Diego Association of Governments) prepares to update their Active Transportation Plan, they are looking for public input. San Diego’s Active Transportation Plan has not been updated since 2010, years before San Diego Association of Governments adopted Vision Zero (2015).

You can help San Diego regional planners by sharing your knowledge of dangerous roads and intersection locations, or places you would like to be able to walk or bike to, or make multi-modal connections through.

“So traffic fatalities, 250 in the San Diego region alone in the last year,” Mieier said [Antoinette Mieier, SANDAG’s Senior Director of Regional Planning]. ” And a third of those fatalities involved pedestrians.

‘Make your mark’: SANDAG seeks public input to improve pedestrian and bicyclist safety

You can find the interactive San Diego County Map online and add your input.

The San Diego map with public input itself should be helpful to those who like to walk or ride their bikes because it informing awareness through the public sourced resource about where to avoid for the time being. For instance, today, the map says there have been 1063 contributions. On the map, locations on the map display a number and the mark for the location changes size and color by relative number of contributors who have identified that same location.

Is there a particular street that you would like to bike or walk on, but you don’t feel safe? Where have you recently experienced a close call on the road while driving, walking, or biking? Are there regional destinations that would benefit from a new or improved biking connection? 

Vision Zero Safer Streets SANDAG Interactive Map for your input

Meanwhile, students at Kennedy School of Government have conducted research to estimate the cost of supporting infrastructure for cars, and the cost whether or not a household owns or does not own a vehicle. The costs are shared by all because about half of the car infrastructure costs (parking, roads etc.) comes from public funds, thus shared by all residents. They put the costs for all households with and without cars at $14,000 with additional costs for those who do own vehicles.

The study authors hope that this data which should be fairly similar for other states.

The costs of any other type of transportation project for any mode can now be roughly compared to the costs already supported by the public for car infrastructure by all residents including households without a car at $14,000. Such comparisons would seem to lend assistance to transportation equity.

A team of graduate students at the Harvard Kennedy School estimate that the annual price tag for maintaining Massachusetts’ car economy is roughly $64.1 billion, with more than half of that coming from public funds. […]

Using publicly available data, the authors put the annual public tab at $35.7 billion, which amounts to about $14,000 for every household in the state. Those that do own vehicles pony up an additional $12,000 on average in direct costs.

The authors say their goal is to demonstrate the total costs of driving so that information can be used for comparison when held up against other types of transit investments, like bus, subway, and train systems.

Driving is more expensive than you think

$14,000 for every household whether or not they own a car! Transportation equity for a household or individual who lives car free and relies on public transportation or a bicycle for all trips is left paying for car infrastructure but not getting improvements of the same proportion to other public transportation infrastructure. That is a whopping amount of money paying for car infrastructure costs like parking for those who do not drive or can’t drive like senior citizens and those who can not afford the expense of owning a vehicle.

Transportation planners sometimes point out that bicycle infrastructure and pedestrian sidewalk infrastructure improvements are considerably less expensive than road infrastructure for cars.

For instance the Mayor of one New Jersey city has actually been able to achieve Vision Zero using low cost and well known tactics to improve safety, six years of no pedestrian fatalities and almost half of the roads have bicycle lanes.

Armed with the Vision Zero plan, Hoboken has steadily been making incremental changes to its streets and transportation policies — with profound results. In 2021, Bhalla welcomed Citi Bike, which as of this summer has recorded more than 850,000 trips. In 2022, he lowered the citywide speed limit to 20 miles per hour (32 kilometers per hour). Crosswalks have been painted and repaved to increase their visibility, and more than 40 curb extensions have been installed to nudge cars farther from intersections. Today, nearly half of Hoboken’s roads have bike lanes.

[…] we kind of take a bird’s eye view of that area and see what low-cost, high-impact measures we can implement in order to make that part of Hoboken a little bit safer. So just with a bucket of paint, you can actually create a curb extension; you can create high visibility crosswalks, which create a much safer environment at a very cheap cost. 

The New Jersey Mayor With a Plan to End Traffic Deaths
In Hoboken, Mayor Ravi Bhalla has worked to redesign city intersections, install bike lanes and slow traffic. The result? Six-plus years of no pedestrian fatalities.

Of course the cost for road improvements and bicycle and pedestrian infrastructure varies greatly.

Many specifics need to be pinned down, but StreetsBlog has some interesting discussion of the range of these costs, for sidewalks, for roads, for bike lanes of various types, $20,000 vs. $100,000-$1,000,000 per mile:

An FHA handbook from 2015, Incorporating On-Road Bicycle Networks into Resurfacing Projects, provides some basic numbers to start with. “Many communities contacted during the production of the Workbook indicated that their average cost to add bike lanes during a resurfacing project is approximately $20,000 (2015 dollars) per mile.”

According to Streetsblog’s sources, the costs to completely repave a road usually vary in the range of $100k per mile up to $1 million per mile – with some outliers. That covers construction costs for complete rehabilitation of a roadway, including scraping and replacing pavement, adding curbs and curb ramps, placing signals and detectors, and restriping and repainting lanes, but not widening a road.

Breaking Down Caltrans’ Cost Estimate of the Complete Streets Bill

San Diego underfunds Pedestrian Safety & rash of bicyclists hit in S. California

Well as folks say Vision Zero has quickly turned to Zero Vision. For lack of funding or will to change. Regardless, pedestrian traffic injuries and fatalities continue to be on track to the highest rate in 50 years.

Thanks to KPBS recent story we learn:

It’s been more than eight years since city officials adopted “Vision Zero,” a goal of ending all traffic deaths and serious injuries by 2025. More than two years from that deadline, the number of total deaths and injuries each year is essentially unchanged. Meanwhile pedestrian deaths are on the rise — both in San Diego and across the country.

Audit finds San Diego severely underfunds pedestrian safety

In short, over 1000 safety priority work projects on the list and a typical year sees approximately 40 or so of these projects done.

Still, the transportation safety rebels are doing a lot with gumption, paint, planters, etc.

Traffic cameras can also increase safety for those not in vehicles and raise revenue for these safety projects. But not much is happening fast.

And 2023 is looking likely to be a worse year than 2022 for bicyclist fatalities.

According to the blog Biking LA on October 31, 2023:

This is at least the 50th bicycling fatality in Southern California this year, and the 16th that I’m aware of in Los Angeles County; it’s also at least the eighth time a person was been killed riding a bicycle in Los Angeles since the start of the year.

Update: Valley Glen man dragged, killed by hit-and-run driver; 4th LA County bike death in 4 days, 15th SoCal rider killed in 25 days

On the wake of the tragic PCH pedestrian car crash fatalities in October, we have more cyclists and pedestrians being seriously injured and killed on our roads.

“Fatal traffic collisions this year have taken 250 lives,” LAPD Chief Michel Moore stated during a recent meeting of the Los Angeles Police Commission. The deaths, from the period of Jan. 1–Oct. 14, was nine more than in the same timeframe in 2022. 

Then Moore added, “​​But most troubling is when we look back to 2019, that number was 188. That’s a 33% increase.”

Los Angeles on pace to surpass 300 traffic collision deaths for second consecutive year

Hit and run car crashes are at an epidemic level. It’s just gone from bad to really, really bad.

But, new gear for cyclists in the form of air bags do offer some on demand safety improvements potentially to cyclists, adding to the traditional helmet.

Scientific research shows that Hövding’s airbag technology offers protection up to eight times better than traditional bicycle helmets. French testing institute Certimoov has given its stamp of approval, confirming that Hövding is the safest option for cyclists.

Should cyclists start wearing airbags or what?

California DMV kicks Cruise Driverless Taxi’s out.

Cruise hid evidence about a Cruise crash injuring a pedestrian.


In the Order of Suspension, the California DMV said that the Cruise vehicle initially came to a hard stop and ran over the pedestrian. After coming to a complete stop, it then attempted to do a “pullover maneuver while the pedestrian was underneath the vehicle.” The car crawled along at 7 mph for about 20 feet, then came to a final stop. The pedestrian remained under the car the whole time.

Cruise Self-Driving License Revoked After It Withheld Pedestrian Injury Footage, DMV Says

Cruise initially withheld the video evidence of the car dragging the pedestrian 20 feet trapped under the vehicle until another California Government agency.

The troubles for Cruise will continue with the Federal investigation of Cruise autonomous vehicles as well as their behavior with pedestrians after reports that the autonomous vehicles do not behave with proper caution around vulnerable pedestrians.

The National Highway Traffic Safety Administration said that the reports involve automated driving system equipped vehicles encroaching on pedestrians present in or entering roadways, including crosswalks. This could raise the risk of a vehicle striking a pedestrian, which could result in severe injury or death, according to the NHTSA.

US regulators investigate GM’s Cruise division over incidents involving pedestrians in roadways

Pedestrian fatalities and serious injuries are spiking on our roadways nationally and right here in California.

San Diego 2018 Pedestrian Fatalities Spike

San Diego pedestrian fatalities in 2018 were twice that of reported pedestrian fatalities in 2017.

The number of pedestrians killed by cars spiked last year to 34 up from 17 in 2017, according to numbers from the San Diego Police Department. Those severely hurt while crossing the street or using the sidewalk rose to 93 last year up from 75 in 2017, while serious injuries for bikers increased to 23, up from 19.


‘Fatal 15’ intersections overhauled as San Diego grapples with pedestrian death
s

Pedestrian injuries and bicyclist injuries also increased in 2018.

San Diego also announced 15 of the most dangerous intersections with completed improvements under the Vision Zero Complete Streets goal of eliminating traffic-related fatalities and severe injuries by 2025. The San Diego Mayor also announced a new $2.45 million grant from CalTrans to improve hundreds of more intersections as well as work toward the complete streets goal.

“This is all about making it safer for everyone – drivers, pedestrians and cyclists – as they navigate city streets,” Mayor Faulconer said. “Making crosswalks more visible and adding audible walk signals are just a few of the simple yet effective ways we can make our neighborhoods safer. I look forward to installing these same safety improvements at hundreds more intersections over the next few years as we rebuild San Diego’s transportation network for the future.”


City Completes Safety Upgrades at 15 of San Diego’s Most Crash-Prone Intersection
s
Mayor Faulconer Announces New Grant Funding to Bring Safety Improvements to Hundreds More Intersections as Part of ‘Vision Zero’ Plan to Reduce Accidents

It is a good time to remember Vision Zero since President’s Day apparently used to be Bicycle Day.

In Boston, cyclists used the public holiday to hold bicycle races before cheering throngs. Local bike stores opened their doors to entice the race-day crowds, bringing them in off the snowy streets to preview the pleasures of spring. February 22 soon marked the start of the season, the day on which bicycle retailers held open houses to show off their latest models to eager crowds. “Yesterday was bicycle day in Boston,” reported the Boston Globe in 1895.


When Presidents Day Was Bicycle Day
Long before Washington’s Birthday was marked by car sales, Americans celebrated their first president by pedaling.


But this recent story about a man in a wheel chair who was hit by cars 3 times in just 10 months really drives home the point of why we need to meet our Vision Zero goals.


Nearly 6,000  pedestrians in the United States were killed in traffic crashes in 2016, according to the latest data available from the National Highway Traffic Safety Administration. The Detroit Free Press, in a series called Death on foot, puts it this way: That’s twice the number of deaths tied directly to the Sept. 11, 2001, terrorist attacks.


This man would like you to stop hitting him with cars

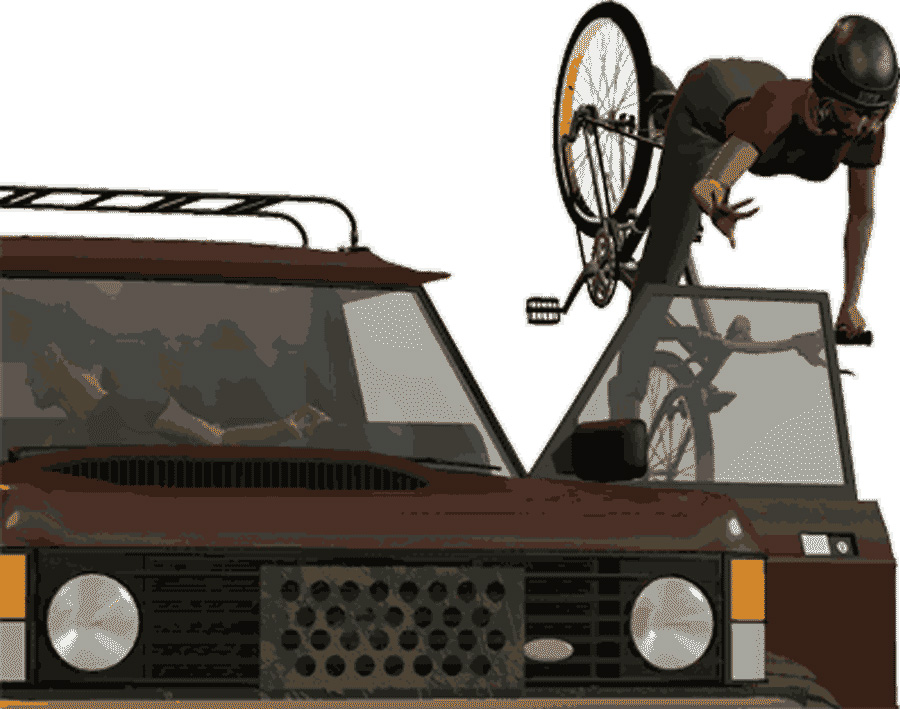
Don’t Door Me!

This is an excellent article not just about dooring accidents, but about bike lane design standards, how bicycle accidents are counted and how the system continues to implement design standards that are sub-standard.

Where Bike Lane Design Collides with Savvy Cycling

National and state databases only include crashes involving motor vehicles in transport. Since a parked car is not in transport, and a bicycle is not a motor vehicle, crashes where a bicyclist hits a parked car door are excluded.


Dooring accounts for 12 to 27 percent of urban car-bike collisions, making it one of the most common crash types.

Cyclists with iPods hear the same as motorists listening to nothing

Finally, researchers have asked the question and found that cyclists with iPods or earbuds on listening to music can actually hear more than drivers and passengers inside automobiles with the windows up listening to nothing.

“We quickly established that cars are remarkably soundproof. We measured the average peak of ambient traffic noise inside the car (with the motor running) to be 54dB, which is 26dB quieter than outside the car. We rang a bike bell right outside an open car window and measured it from in the car at 105dB. With the window closed, the same bell registered just 57dB.”


Ride On magazine of Australia

Here’s an article about this study which links to the original article.
Oz mag set out to find out if “iPod wearing zombies” heard more or less than motorists with their windows up or music playing.

BAD NEWS SHARROWS some infrastructure worse than none

From a study out of University of Colorado sharrows may actually do more harm for bicycle riders than good.

Some Bike Infrastructure Is Worse Than None at All

But far from giving cyclists a safer ride, or even doing nothing at all, sharrows might actually be doing some harm by tugging bikes into moving traffic. Some research has found they do reduce dooring (when the door of a parked car hits a cyclist). But only one study to date looked at whether or not sharrows had any impact on overall car-bike collisions—and that study found they could be increasing the risk of injury.

Drivers, Look For Cyclists And Help Them Not Get Doored

Getting Doored for a cyclist is a very serious, even potentially deadly accident.

Bike Lanes are often placed too near parked cars, or as cyclists say, in the door zone. Cyclists are often boxed in a very narrow line of safety next to a busy lane of traffic while riding on the far outside of a bike lane to stay out of door zones.

Drivers, you can help. Start the “Dutch Reach” and teach your passengers to do the same.

Teach your friends and kids that bicycle to be aware of the danger of door zones too.

The Dutch Reach is a simple change in behavior, but it automatically puts your body in a position to be looking before opening your car door.

Fatal bike crashes are on the rise in the United States; in 2016 the highest number of cyclist deaths since 1991 was recorded. The research doesn’t say how many of those deaths are from doorings specifically, or how effective the Dutch Reach method is in preventing crashes, but a study done in 2015 in Vancouver, British Columbia, found that the car-to-cyclist crash type with the most injuries was doorings, said Kay Teschke, professor emeritus at the School of Population and Public Health at the University of British Columbia in Vancouver.

San Diego Bicycling – Will We Have Vision Zero or Zero Vision?

San Diego’s infrastructure funding gap grows by $310M
San Diego Union Tribune
January 28, 2018

An ambitious plan to build 77 miles of bicycle lanes throughout the San Diego region is behind schedule — with less than four miles open to the public and more than $60 million spent. Officials with the San Diego Association of Governments have said that much of that money has been for used for design and community outreach, which accounts for roughly 40 percent of an average project under the program.

Still, it is an ambitious plan and in the end, San Diego County will have an amazing network. But, the delays really are adding up.

But, on the other hand, incredibly projects are also breaking ground or close to opening.

SANDAG Budget Has More Delays For Priority Bike Projects
KPBS
2-8-2018

One project that would create separated bike and pedestrian paths along Pershing Drive through Balboa Park is facing a construction delay of about 10 months. The corridor is a key missing link in San Diego’s bike network that would connect densely populated Mid-City neighborhoods with downtown.

Meanwhile, with all the delays and already many years out from the beginning of Vision Zero push pedestrian traffic fatalities are happening too often in San Diego County, fatalities which could and should be prevented under the Vision Zero goals.

Pedestrian deaths in San Diego rack up as city drags on Vision Zero
San Diego Union Tribune
2-11-2018

While traffic-related fatalities in the city declined last year, the number of deaths still eclipsed homicides, including 17 pedestrian deaths on top of hundreds of often crippling injuries. Since January, nine people walking the streets of San Diego have been killed by motorists.

So, we’re behind schedule, and unlike New York City having the lowest pedestrian fatalities to an all time low, we’re still seeing pedestrian fatalities, and numerous crashes leaving people seriously injured with life long lasting consequences.

At the same time, more than 500 pedestrians a year are wounded or seriously injured in motor vehicle accidents, according to a City Auditor’s report from 2016.

‘Vision Zero’ brings traffic fatalities in New York to an all-time low
L.A. Times
2-1-2018

It appears to be working. Total traffic fatalities in the city, including those involving pedestrians, cyclists, motorcyclists and motor vehicles, fell from 299 in 2013 to an all-time low of 214 last year.

Pedestrian deaths were down from 184 to 101, though deaths of bicyclists rose from 12 to 23.

A lot of challenges remain for San Diego County. We know that the idea and strategy of Vision Zero works, prioritize the most dangerous streets and intersections, make road design safer, and when this all happens, everyone has a place to move in traffic safely, cars, pedestrians, strollers, bicycles. And, studies show that these road improvements actually make shopping in cities better for businesses because people can walk around and people are drawn to shopping and restaurants where these improvements have happened.

But data points to priorities, and improvements take studies and money, and time. What are we going to do if we are running out of both money and time and the organization for collecting the data and prioritizing the projects is also lagging.

San Diego’s infrastructure funding gap grows by $310M
San Diego Union Tribune
2-13-18

On sidewalks, the projected need is $166 million and only $14 million is expected to be available.

There are similar gaps on streetlights, $204 million versus $1.4 million; traffic signals, $144 million versus $11 million; and bike lanes, $122 million versus $6 million.