8 Years of San Diego Vision Zero

Things are looking only worse marking the World Day of Remembrance.

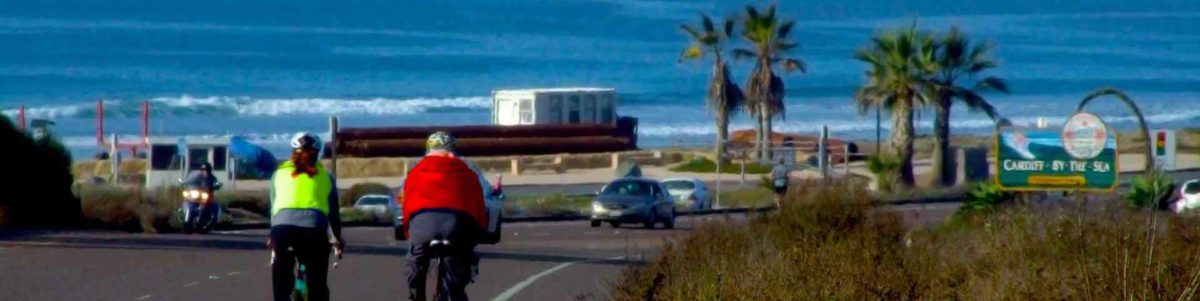
Southern California is in the middle of a true crisis with cyclists and pedestrians being mamed and killed on streets with alarming frequency. Little seems to have changed for the better if not getting actually worse.

With the city’s Vision Zero deadline of 2025 just over one year away, the death toll on San Diego streets is essentially unchanged. Two people died in collisions on Thursday (11/16/2023), bringing the number of traffic deaths in 2023 to at least 50, according to city data. In 2022, at least 53 people died in collisions in the same time period.

On ‘World Day of Remembrance,’ families to honor victims of traffic collisions

Officials in San Diego County are listening. In fact, the San Diego County officials created a new tool to get public input about areas that they have safety concerns walking, biking, or maybe could be leveraged for network connectivity or would benefit a regional destination.

As SANDAG (San Diego Association of Governments) prepares to update their Active Transportation Plan, they are looking for public input. San Diego’s Active Transportation Plan has not been updated since 2010, years before San Diego Association of Governments adopted Vision Zero (2015).

You can help San Diego regional planners by sharing your knowledge of dangerous roads and intersection locations, or places you would like to be able to walk or bike to, or make multi-modal connections through.

“So traffic fatalities, 250 in the San Diego region alone in the last year,” Mieier said [Antoinette Mieier, SANDAG’s Senior Director of Regional Planning]. ” And a third of those fatalities involved pedestrians.

‘Make your mark’: SANDAG seeks public input to improve pedestrian and bicyclist safety

You can find the interactive San Diego County Map online and add your input.

The San Diego map with public input itself should be helpful to those who like to walk or ride their bikes because it informing awareness through the public sourced resource about where to avoid for the time being. For instance, today, the map says there have been 1063 contributions. On the map, locations on the map display a number and the mark for the location changes size and color by relative number of contributors who have identified that same location.

Is there a particular street that you would like to bike or walk on, but you don’t feel safe? Where have you recently experienced a close call on the road while driving, walking, or biking? Are there regional destinations that would benefit from a new or improved biking connection? 

Vision Zero Safer Streets SANDAG Interactive Map for your input

Meanwhile, students at Kennedy School of Government have conducted research to estimate the cost of supporting infrastructure for cars, and the cost whether or not a household owns or does not own a vehicle. The costs are shared by all because about half of the car infrastructure costs (parking, roads etc.) comes from public funds, thus shared by all residents. They put the costs for all households with and without cars at $14,000 with additional costs for those who do own vehicles.

The study authors hope that this data which should be fairly similar for other states.

The costs of any other type of transportation project for any mode can now be roughly compared to the costs already supported by the public for car infrastructure by all residents including households without a car at $14,000. Such comparisons would seem to lend assistance to transportation equity.

A team of graduate students at the Harvard Kennedy School estimate that the annual price tag for maintaining Massachusetts’ car economy is roughly $64.1 billion, with more than half of that coming from public funds. […]

Using publicly available data, the authors put the annual public tab at $35.7 billion, which amounts to about $14,000 for every household in the state. Those that do own vehicles pony up an additional $12,000 on average in direct costs.

The authors say their goal is to demonstrate the total costs of driving so that information can be used for comparison when held up against other types of transit investments, like bus, subway, and train systems.

Driving is more expensive than you think

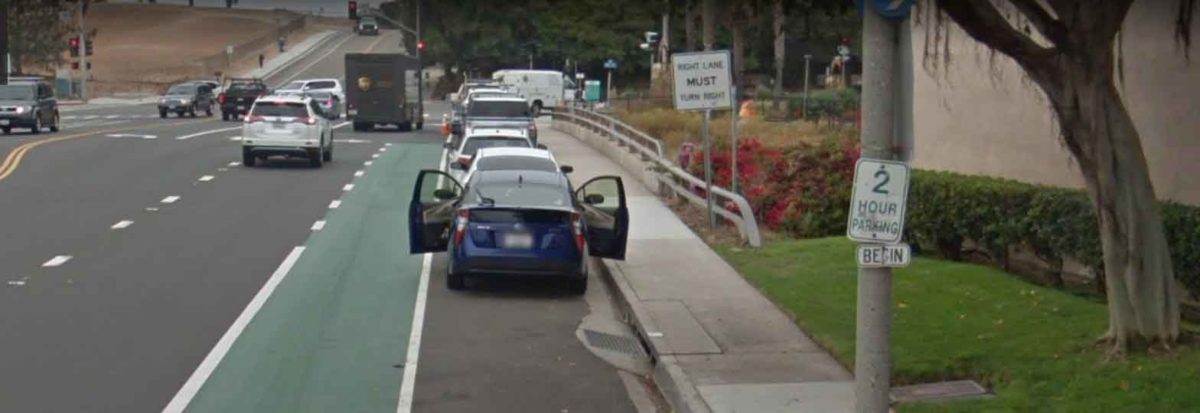
$14,000 for every household whether or not they own a car! Transportation equity for a household or individual who lives car free and relies on public transportation or a bicycle for all trips is left paying for car infrastructure but not getting improvements of the same proportion to other public transportation infrastructure. That is a whopping amount of money paying for car infrastructure costs like parking for those who do not drive or can’t drive like senior citizens and those who can not afford the expense of owning a vehicle.

Transportation planners sometimes point out that bicycle infrastructure and pedestrian sidewalk infrastructure improvements are considerably less expensive than road infrastructure for cars.

For instance the Mayor of one New Jersey city has actually been able to achieve Vision Zero using low cost and well known tactics to improve safety, six years of no pedestrian fatalities and almost half of the roads have bicycle lanes.

Armed with the Vision Zero plan, Hoboken has steadily been making incremental changes to its streets and transportation policies — with profound results. In 2021, Bhalla welcomed Citi Bike, which as of this summer has recorded more than 850,000 trips. In 2022, he lowered the citywide speed limit to 20 miles per hour (32 kilometers per hour). Crosswalks have been painted and repaved to increase their visibility, and more than 40 curb extensions have been installed to nudge cars farther from intersections. Today, nearly half of Hoboken’s roads have bike lanes.

[…] we kind of take a bird’s eye view of that area and see what low-cost, high-impact measures we can implement in order to make that part of Hoboken a little bit safer. So just with a bucket of paint, you can actually create a curb extension; you can create high visibility crosswalks, which create a much safer environment at a very cheap cost. 

The New Jersey Mayor With a Plan to End Traffic Deaths
In Hoboken, Mayor Ravi Bhalla has worked to redesign city intersections, install bike lanes and slow traffic. The result? Six-plus years of no pedestrian fatalities.

Of course the cost for road improvements and bicycle and pedestrian infrastructure varies greatly.

Many specifics need to be pinned down, but StreetsBlog has some interesting discussion of the range of these costs, for sidewalks, for roads, for bike lanes of various types, $20,000 vs. $100,000-$1,000,000 per mile:

An FHA handbook from 2015, Incorporating On-Road Bicycle Networks into Resurfacing Projects, provides some basic numbers to start with. “Many communities contacted during the production of the Workbook indicated that their average cost to add bike lanes during a resurfacing project is approximately $20,000 (2015 dollars) per mile.”

According to Streetsblog’s sources, the costs to completely repave a road usually vary in the range of $100k per mile up to $1 million per mile – with some outliers. That covers construction costs for complete rehabilitation of a roadway, including scraping and replacing pavement, adding curbs and curb ramps, placing signals and detectors, and restriping and repainting lanes, but not widening a road.

Breaking Down Caltrans’ Cost Estimate of the Complete Streets Bill

San Diego underfunds Pedestrian Safety & rash of bicyclists hit in S. California

Well as folks say Vision Zero has quickly turned to Zero Vision. For lack of funding or will to change. Regardless, pedestrian traffic injuries and fatalities continue to be on track to the highest rate in 50 years.

Thanks to KPBS recent story we learn:

It’s been more than eight years since city officials adopted “Vision Zero,” a goal of ending all traffic deaths and serious injuries by 2025. More than two years from that deadline, the number of total deaths and injuries each year is essentially unchanged. Meanwhile pedestrian deaths are on the rise — both in San Diego and across the country.

Audit finds San Diego severely underfunds pedestrian safety

In short, over 1000 safety priority work projects on the list and a typical year sees approximately 40 or so of these projects done.

Still, the transportation safety rebels are doing a lot with gumption, paint, planters, etc.

Traffic cameras can also increase safety for those not in vehicles and raise revenue for these safety projects. But not much is happening fast.

And 2023 is looking likely to be a worse year than 2022 for bicyclist fatalities.

According to the blog Biking LA on October 31, 2023:

This is at least the 50th bicycling fatality in Southern California this year, and the 16th that I’m aware of in Los Angeles County; it’s also at least the eighth time a person was been killed riding a bicycle in Los Angeles since the start of the year.

Update: Valley Glen man dragged, killed by hit-and-run driver; 4th LA County bike death in 4 days, 15th SoCal rider killed in 25 days

On the wake of the tragic PCH pedestrian car crash fatalities in October, we have more cyclists and pedestrians being seriously injured and killed on our roads.

“Fatal traffic collisions this year have taken 250 lives,” LAPD Chief Michel Moore stated during a recent meeting of the Los Angeles Police Commission. The deaths, from the period of Jan. 1–Oct. 14, was nine more than in the same timeframe in 2022. 

Then Moore added, “​​But most troubling is when we look back to 2019, that number was 188. That’s a 33% increase.”

Los Angeles on pace to surpass 300 traffic collision deaths for second consecutive year

Hit and run car crashes are at an epidemic level. It’s just gone from bad to really, really bad.

But, new gear for cyclists in the form of air bags do offer some on demand safety improvements potentially to cyclists, adding to the traditional helmet.

Scientific research shows that Hövding’s airbag technology offers protection up to eight times better than traditional bicycle helmets. French testing institute Certimoov has given its stamp of approval, confirming that Hövding is the safest option for cyclists.

Should cyclists start wearing airbags or what?

Report finds San Diego saw 71% increase in biking since 2019

According to KPBS new report shows that San Diego people want to ride their bicycles. New bicycle infrastructure, kid oriented bicycle parks are getting used.

A new report on biking trends across the country found the San Diego metropolitan region saw a 71% increase in biking from 2019 to 2022 — the second largest increase in the country.

KPBS 9/28/2023

While this is huge, San Diego still has a long way to go. Cyclists say many of the new bike paths aren’t connected.

Work to do, but the demand is clearly here.

Build it and they will ride bikes.

Not mentioned in the cycling growth, e-bikes.

E-bikes have brought a lot of new bicycle riders and commuters to cycling. For folks who had longer commutes, hills, or even less safe routes, e-bikes are a game changer.

With San Diego’s great weather, active lifestyle, of course people want to ride bicycles.

Let’s Go! By Bike of course.

Truck Underride Crashes Can Be Deadly, And Avoidable with side and rear guards

In the USA bicycle safety advocates call for these side guards to be made a requirement on all commercial trucks. The safety improvement would affect safety for cars, pedestrians, motorcycles and bicyclists.

Bicyclist Hit by Dump Truck and Pinned Underneath in Otay Mesa Collision

For pedestrians, bikes, small cars, scooters, mopeds, electric bikes, even small car drivers: being near a large truck in traffic on city streets is an everyday dangerous type of situation.

If large trucks and dump trucks were required to have rear and side guards, all vulnerable road users would be safer.

In the USA bicycle safety advocates call for these side guards to be made a requirement on all commercial trucks. The safety improvement would affect safety for cars, pedestrians, motorcycles and bicyclists.

“Truck lateral protective devices are vehicle-based safety devices designed to keep pedestrians, bicyclists, and motorcyclists from being run over by a large truck’s rear wheels in a side-impact collision. While large trucks comprise 4 percent of registered vehicles, large trucks are involved in 10 percent of pedestrian and bicyclist fatalities. In 2018, these nonmotorist fatalities rose to 541, the highest since 1990.” Truck Lateral Protective Device

The lives that could be saved by mandating side and rear guards for big trucks and semi trailers would be huge. The most recent NHTSA analysis looked only at crashes that occurred at speeds under 40 mph, and most of the experts in the USA gave push back, “NTSB, IIHS say feds significantly underestimate lives that can be saved.”

That benefit shortfall alarms the National Transportation Safety Board (NTSB), which contends NHTSA’s analysis focused only on crashes in which the front of a passenger vehicle slides under the side of a trailer. NHTSA did not fully consider other crash types that would likely benefit from side guards installed on a truck that could prevent such an “underride,” according to NTSB, such as high-speed sideswipe crashes, impacts with vulnerable road users such as motorcyclists, cyclists and pedestrians, or side underride collisions with single-unit trucks.

“Further, NHTSA only calculated potential safety benefits for about 20% of fatal crashes in which NHTSA estimated that the passenger vehicle was traveling under 40 mph,” wrote NTSB Chair Jennifer Homendy in comments filed in response to the proposal. “For crashes where the estimated speed was over 40 mph, NHTSA’s analysis assumed that a side underride guard would have no effectiveness.”

NACTO Statement re: Mandatory Helmet Laws

NTSB is getting a lot of pushback from its recent statement about bicycle safety on our roads.

In the NTSB’s first examination of bicyclist safety on U.S. roadways since its last report on this topic in 1972, the agency said critical changes were needed to address the recent rise in fatal bicycle crashes involving motor vehicles, even as overall traffic deaths fell in 2018. 

[…] The investigators’ primary focus was on crash avoidance, but in those instances when crashes do occur, they said the use of a helmet was the single most effective way for riders to reduce their chances of receiving a serious head injury. Because research shows that less than half of bicyclists wear helmets and that head injuries were the leading cause of bicyclist fatalities, the NTSB recommended that all 50 states, the District of Columbia and Puerto Rico, require that all persons wear a helmet while riding a bicycle.

NTSB News Release 11/5/2019 NTSB Says Changes to Roadway Design, Collision Avoidance Systems, More Helmet Use Needed to Address Increase in Bicyclist Fatalities

Many people assume that bicycle helmets offer greater protection than they are actually designed to provide. Bicycle helmets are not currently designed for impacts as forceful as a vehicle crash. Bicycle helmets only offer minimal protection for a cyclist if falling say, off the bike and hitting the curb.  Bicycle helmets are not even designed nor tested for any kind of strength that would be necessary to withsand the impact from a vehicle. Even if bicycle helmets were designed as well as motorcycle helmets, dangerous drivers are still a huge problem, and cyclists as well as pedestrians are getting seriously injured and too often killed.

This is not Vision Zero.

Please read the NACTO statement in full where they discuss the Australian mandatory adult helmet law result data, which showed no safety improvement, and rather, the law discouraged bicycle riding.

For the first time since 1972, the National Transportation Safety Board (NTSB) turned its attention to bicycle safety and released a series of recommendations to protect people on bikes on US streets. NACTO applauds the Board’s road design and bike infrastructure recommendations and renewed focus on this topic as cyclist fatalities in the US hit an 18-year high in 2018. However, a last-minute recommendation that states adopt mandatory helmet laws flies in the face of best practice on bicycle safety.

While requiring helmets may seem like an intuitive way to protect riders, the evidence doesn’t bear this out. Experience has shown that while bike helmets can be protective, bike helmet laws are not.

NACTO Statement ON NTSB Mandatory Helmet Laws

San Diego 2018 Pedestrian Fatalities Spike

San Diego pedestrian fatalities in 2018 were twice that of reported pedestrian fatalities in 2017.

The number of pedestrians killed by cars spiked last year to 34 up from 17 in 2017, according to numbers from the San Diego Police Department. Those severely hurt while crossing the street or using the sidewalk rose to 93 last year up from 75 in 2017, while serious injuries for bikers increased to 23, up from 19.


‘Fatal 15’ intersections overhauled as San Diego grapples with pedestrian death
s

Pedestrian injuries and bicyclist injuries also increased in 2018.

San Diego also announced 15 of the most dangerous intersections with completed improvements under the Vision Zero Complete Streets goal of eliminating traffic-related fatalities and severe injuries by 2025. The San Diego Mayor also announced a new $2.45 million grant from CalTrans to improve hundreds of more intersections as well as work toward the complete streets goal.

“This is all about making it safer for everyone – drivers, pedestrians and cyclists – as they navigate city streets,” Mayor Faulconer said. “Making crosswalks more visible and adding audible walk signals are just a few of the simple yet effective ways we can make our neighborhoods safer. I look forward to installing these same safety improvements at hundreds more intersections over the next few years as we rebuild San Diego’s transportation network for the future.”


City Completes Safety Upgrades at 15 of San Diego’s Most Crash-Prone Intersection
s
Mayor Faulconer Announces New Grant Funding to Bring Safety Improvements to Hundreds More Intersections as Part of ‘Vision Zero’ Plan to Reduce Accidents

It is a good time to remember Vision Zero since President’s Day apparently used to be Bicycle Day.

In Boston, cyclists used the public holiday to hold bicycle races before cheering throngs. Local bike stores opened their doors to entice the race-day crowds, bringing them in off the snowy streets to preview the pleasures of spring. February 22 soon marked the start of the season, the day on which bicycle retailers held open houses to show off their latest models to eager crowds. “Yesterday was bicycle day in Boston,” reported the Boston Globe in 1895.


When Presidents Day Was Bicycle Day
Long before Washington’s Birthday was marked by car sales, Americans celebrated their first president by pedaling.


But this recent story about a man in a wheel chair who was hit by cars 3 times in just 10 months really drives home the point of why we need to meet our Vision Zero goals.


Nearly 6,000  pedestrians in the United States were killed in traffic crashes in 2016, according to the latest data available from the National Highway Traffic Safety Administration. The Detroit Free Press, in a series called Death on foot, puts it this way: That’s twice the number of deaths tied directly to the Sept. 11, 2001, terrorist attacks.


This man would like you to stop hitting him with cars

Don’t Door Me!

This is an excellent article not just about dooring accidents, but about bike lane design standards, how bicycle accidents are counted and how the system continues to implement design standards that are sub-standard.

Where Bike Lane Design Collides with Savvy Cycling

National and state databases only include crashes involving motor vehicles in transport. Since a parked car is not in transport, and a bicycle is not a motor vehicle, crashes where a bicyclist hits a parked car door are excluded.


Dooring accounts for 12 to 27 percent of urban car-bike collisions, making it one of the most common crash types.

8 Bike Rides in LA Area

These look amazing – and largely car free. We’re talking miles and miles!

We know there are even more — but these are a great place to start and deserve a book mark. This article also includes directions and links to Google Maps — all you need to get you there on your bike.

Note: folks warn about one of these rides:


The LA River part of the ride is fenced off after the homeless encampment that now takes up the half of the sidewalk just after Los Feliz blvd. DO NOT DO the LA River part of the Griffith Park loop. You’ve been warned.


8 Amazing Bike Rides In Los Angeles

Unfortunately, this isn’t the only bike path which we’ve heard about safety problems.

Cyclists with iPods hear the same as motorists listening to nothing

Finally, researchers have asked the question and found that cyclists with iPods or earbuds on listening to music can actually hear more than drivers and passengers inside automobiles with the windows up listening to nothing.

“We quickly established that cars are remarkably soundproof. We measured the average peak of ambient traffic noise inside the car (with the motor running) to be 54dB, which is 26dB quieter than outside the car. We rang a bike bell right outside an open car window and measured it from in the car at 105dB. With the window closed, the same bell registered just 57dB.”


Ride On magazine of Australia

Here’s an article about this study which links to the original article.
Oz mag set out to find out if “iPod wearing zombies” heard more or less than motorists with their windows up or music playing.